rerun-io--rerun
 wehub-resource-sync
2.8 KiB
2.8 KiB
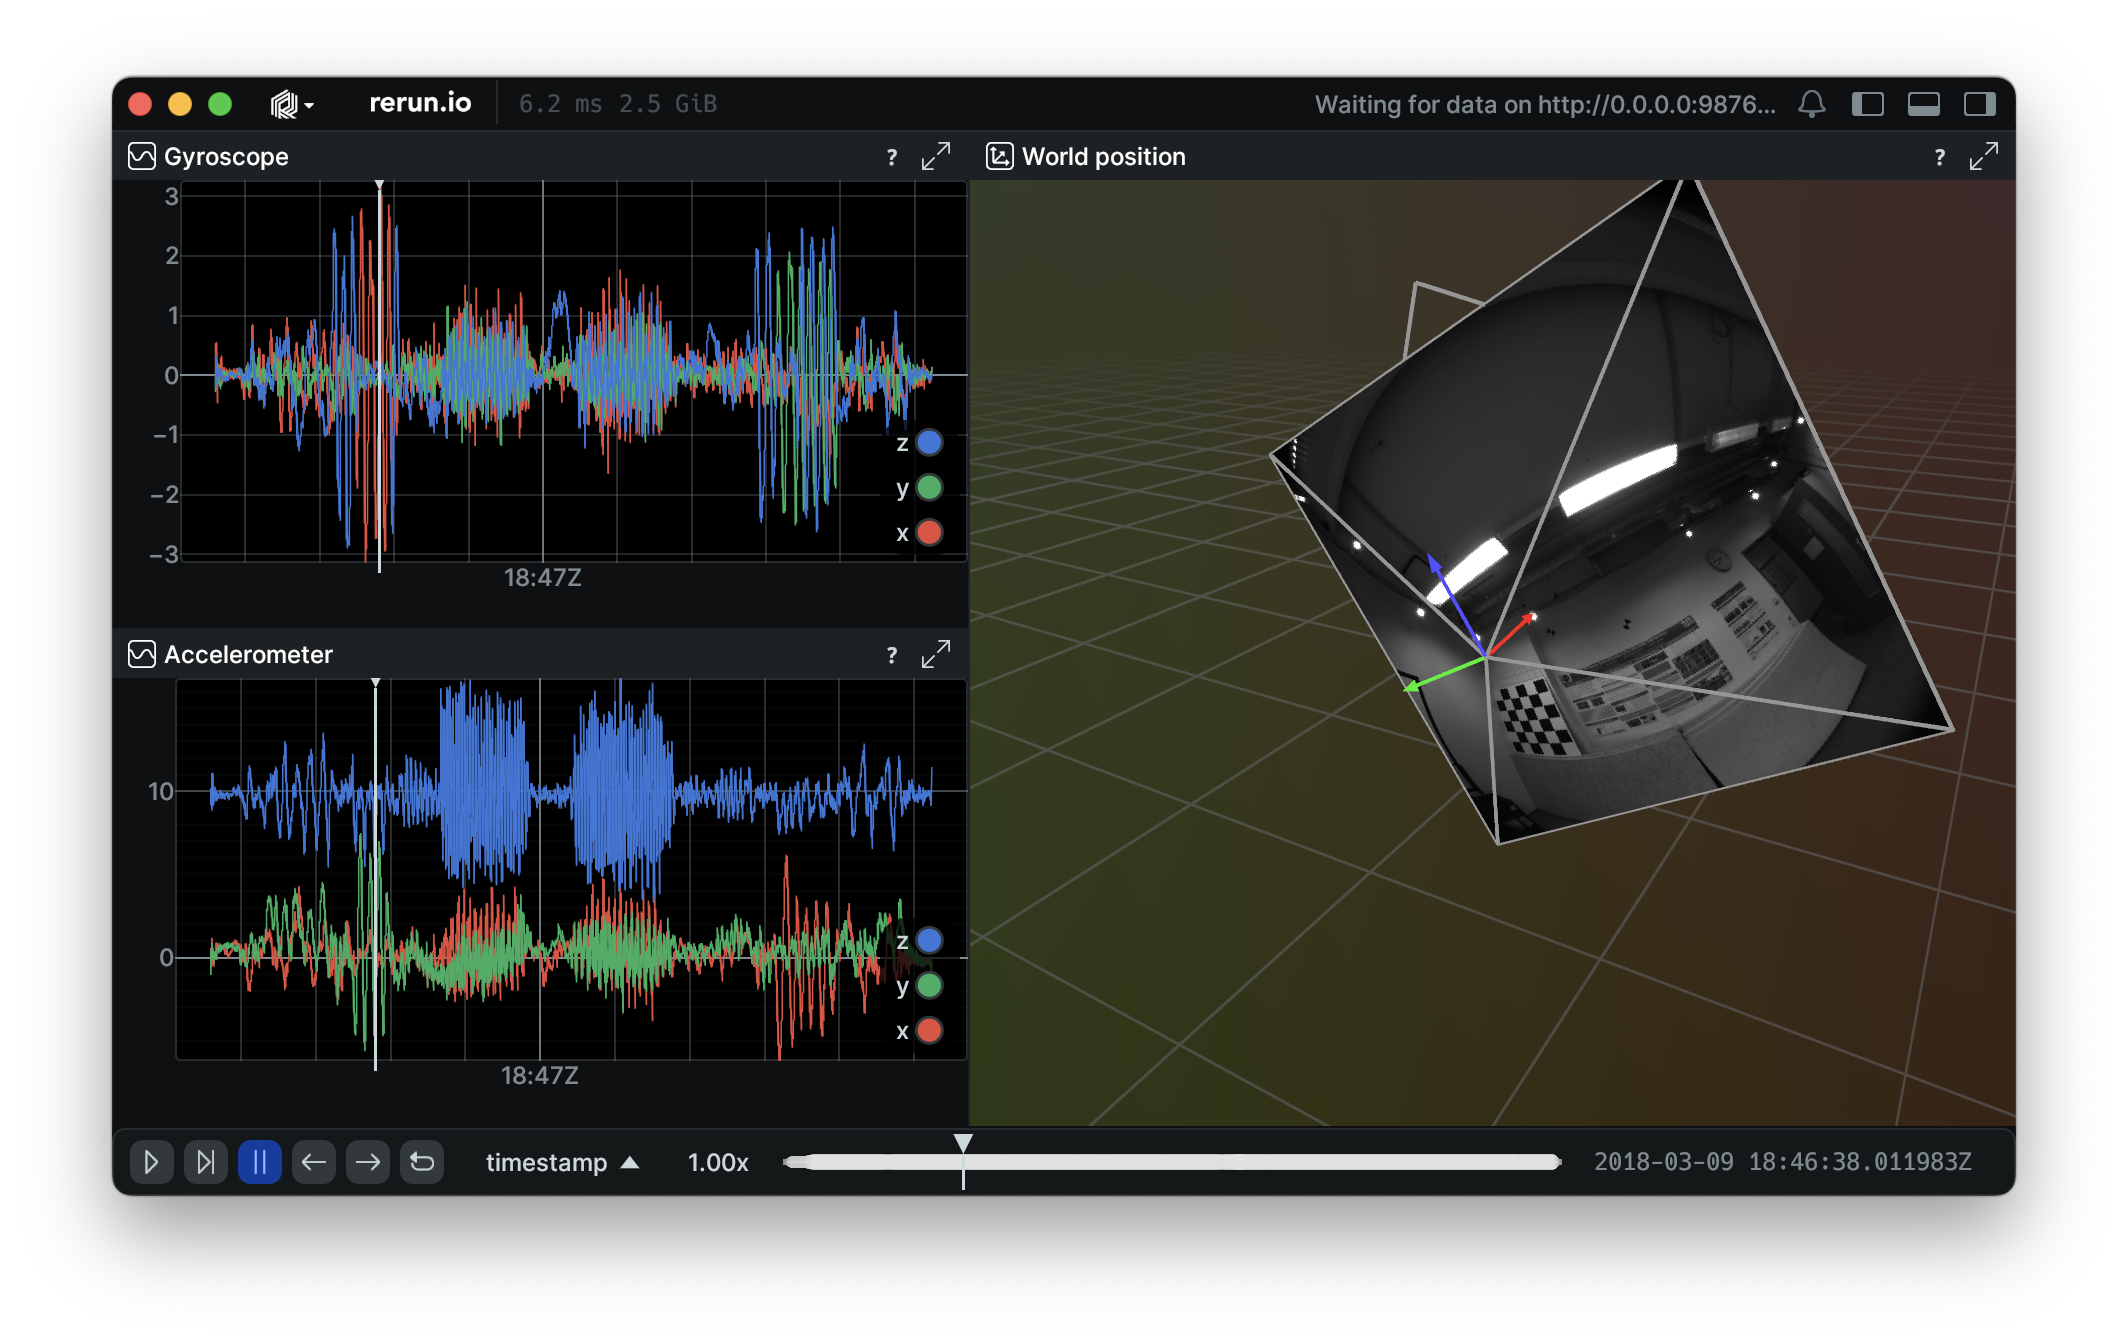
This example demonstrates how to log multi dimensional signals with the Rerun SDK, using the TUM VI Benchmark.
Background
This example shows how to log multi-dimensional signals efficiently using the rr.send_columns() API.
The API automatically selects the right partition sizes, making it simple to log scalar signals like this:
# Load IMU data from CSV into a dataframe
imu_data = pd.read_csv(
    cwd / DATASET_NAME / "dso/imu.txt",
    sep=" ",
    header=0,
    names=["timestamp", "gyro.x", "gyro.y", "gyro.z", "accel.x", "accel.y", "accel.z"],
    comment="#",
)

times = rr.TimeColumn("timestamp", timestamp=imu_data["timestamp"])

# Extract gyroscope data (x, y, z axes) and log it to a single entity.
gyro = imu_data[["gyro.x", "gyro.y", "gyro.z"]]
rr.send_columns("/gyroscope", indexes=[times], columns=rr.Scalars.columns(scalars=gyro))

# Extract accelerometer data (x, y, z axes) and log it to a single entity.
accel = imu_data[["accel.x", "accel.y", "accel.z"]]
rr.send_columns("/accelerometer", indexes=[times], columns=rr.Scalars.columns(scalars=accel))
Running
Install the example package:
pip install -e examples/python/imu_signals
To experiment with the provided example, simply execute the main Python script:
python -m imu_signals
Attribution
This example uses a scene from the TUM VI Benchmark dataset, originally provided by Technical University of Munich (TUM). The dataset is licensed under Creative Commons Attribution 4.0 (CC BY 4.0).
- Original dataset: TUM VI Benchmark
- License details: CC BY 4.0